Peak calling for CLIP-Seq data by omniCLIP [1]
Peak calling for CLIP-Seq data by omniCLIP [1]
.
I have used omniCLIP to analyze CLIP data a few months ago, but the software is poorly maintained. The author is also incompetent, as they didn’t even clearly explain the output files.
Although the software is quite bad, I still want to record how to use it.
I have skimmed through this papers (about the omniCLIP), and now I will provide a brief explanation of its computational principles and algorithm.
This paper ( Philipp et. al. 2018,Genome biology) employ a Non-Homogeneous Hidden Markov Model (NHMM) to segment the genome into peaks and non-peaks. The emission probability of the NHMM is given by the product of the joint probability of the coverage and the probability of the observed diagnostic event frequency in all replicate CLIP and background libraries.
And a Negative Binomial based Generalized Linear Model (that models both confounding by the gene expression, and confounding of local effects and also allows to account for excess variance) are used to model the reads coverage.
Besides, the diagnostic events are modeled using a Dirichlet-Multinomial mixture model. The transition probabilities of the model are based on a logistic function that depends on the coverage.
The diagram below illustrates the algorithmic of omniCLIP.
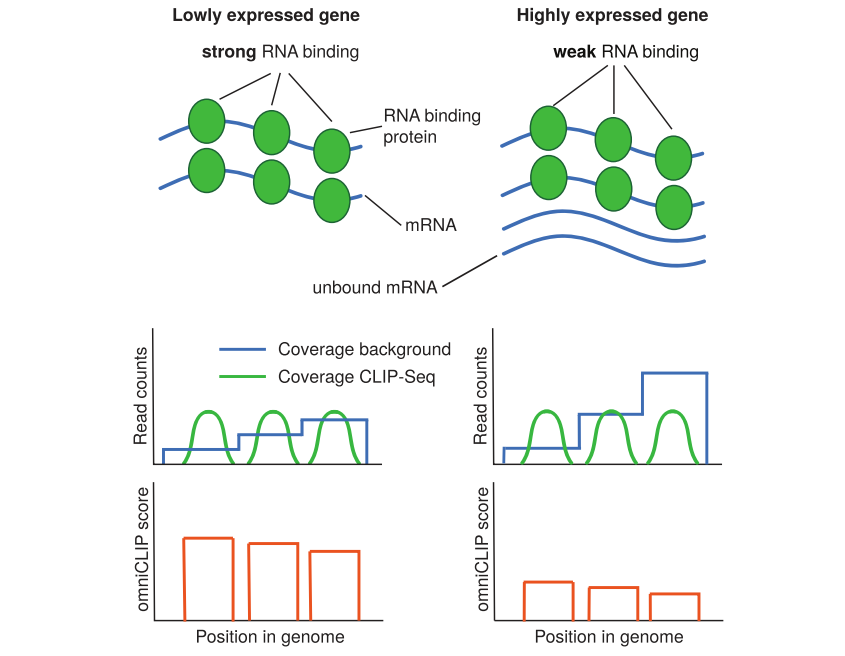
show on the (left) is peak calling for a lowly expressed genes with strong RNA binding protein (RBP) RNA-binding and on the (right) a highly expressed gene with weak RBP RNA-binding. During peak calling, local background coverage is taken into account to correct for confounding by local effects or biases. Furthermore, overall the RNA abundance is estimated and accounted for. This allows better ranking peaks with identical local coverage by sharing of information along the transcript, as illustrated for the leftmost peaks in both genes.
1. data preparation
1.1). data
GSE98188 from paper :
Drosophila Sister-of-Sex-lethal reinforces a male-specific gene expression pattern by controlling Sex-lethal alternative splicing.
Nucleic Acids Res 2019
data download
1 | |
1.2). data clean
Since the paper did not provide the adapter sequences and the length and position of the UMI.
I tried different methods to mark and remove the UMI and adapter.
a). remove adapter
To detect the adapter sequences used, I first processed the raw sequencing data with trim_galore.
1 | |
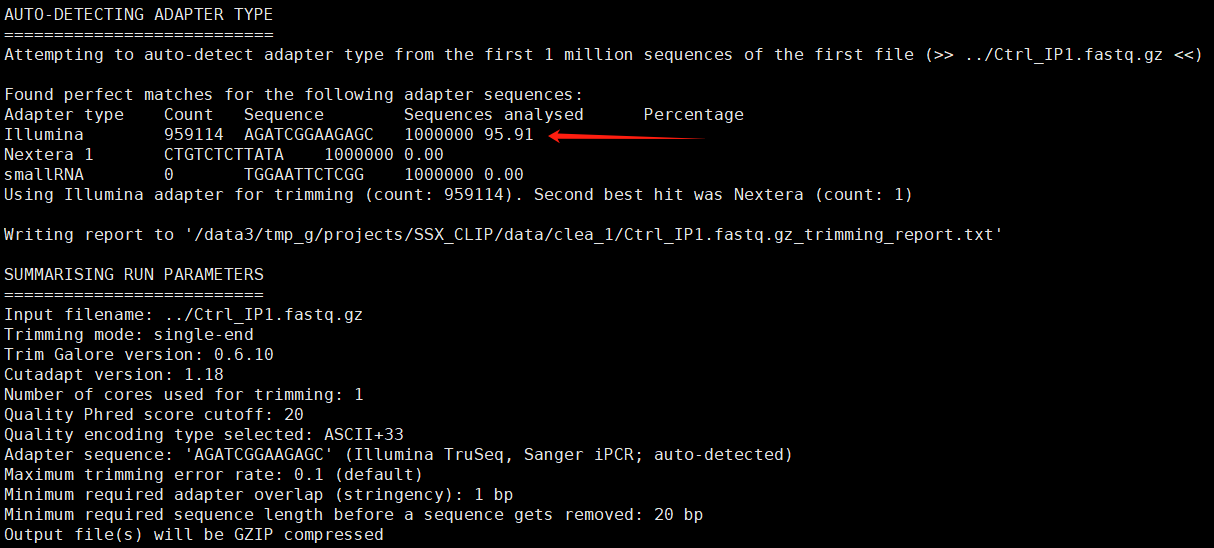
Based on the “auto-detection adapter” in the above figure, we can infer that the adapter sequence is AGATCGGAAGAGC.
The same processing method was applied to the other samples as well.
Therefore, removing the adapter from the raw sequence data based on the sequences identified above.
1 | |
b). mark UMI
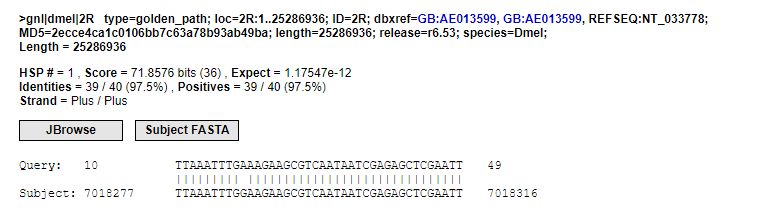
I used the adapters-removed reads for a BLAST against the genome in flybase and found that there are always 10 unpaired bases at the 5’ end of the reads. Therefore, I suspect these are the UMI, as shown in the figure below.
read-@SRR5480967.11 11/1 length = 53 bp 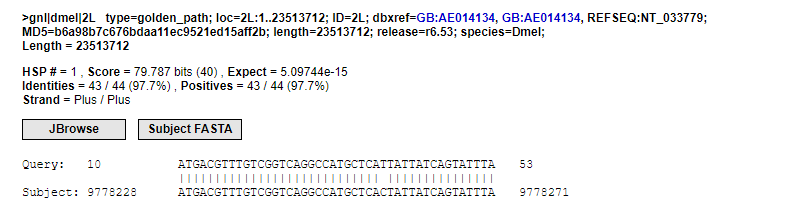
read-@SRR5480967.218 218/1 length = 51 bp
Next, I used the flexbar software to mark the UMIs in the reads.
1 | |
1 | |
2.omniCLIP for CLIP-Seq peaks calling
2.1). intsall omniCLIP
download
1 | |
create conda env
1 | |
install
1 | |
2.2). build a db files of annotation gtf
1 | |
error
1 | |
2.3). parsing the background files
(Usually RNA-SEQ data, but sometimes input data is used)
1 | |
2.4). parsing the CLIP files
1 | |
2.5). Running the omniCLIP algorithm
1 | |