1
2
3
4
5
6
7
8
9
10
11
12
13
14
15
16
17
18
19
20
21
22
23
24
25
26
27
28
29
30
31
32
33
34
35
36
37
38
39
40
41
42
43
44
45
46
47
48
49
50
51
52
53
54
55
56
57
58
59
|
library(org.Dm.eg.db)
library(clusterProfiler)
library(DOSE)
library(topGO)
library(pathview)
library(KEGG.db)
library(enrichplot)
setwd("E:/220625_PC/R workplace/220320_SXL/202404_Fig/240506")
library(readxl)
expr_gene <- read_xlsx("DEGs_240506.xlsx",sheet = "new.diff_gene_all_S2",skip = 0)
geneList<-expr_gene[,c("GeneID","log2FoldChange")]
eg <- bitr(geneList$GeneID,
fromType="ENSEMBL",
toType=c("ENTREZID","ENSEMBL",'SYMBOL'),
OrgDb="org.Dm.eg.db")
head(eg)
input_data <- merge(eg,geneList,by.x="ENSEMBL",by.y="GeneID")
input_data_sort <- input_data[order(input_data$log2FoldChange, decreasing = T),]
gene_fc = input_data_sort$log2FoldChange
names(gene_fc) <- input_data_sort$ENTREZID
head(gene_fc)
GO <- gseGO(
gene_fc,
ont = "ALL",
OrgDb = org.Dm.eg.db,
keyType = "ENTREZID",
pvalueCutoff = 1,
pAdjustMethod = "BH")
head(GO[,1:4])
go_terms <- as.data.frame(GO)
if (!file.exists("E:/220625_PC/R workplace/220320_SXL/202404_Fig/241231")){
dir.create("E:/220625_PC/R workplace/220320_SXL/202404_Fig/241231")
setwd("E:/220625_PC/R workplace/220320_SXL/202404_Fig/241231")
} else {
setwd("E:/220625_PC/R workplace/220320_SXL/202404_Fig/241231")
}
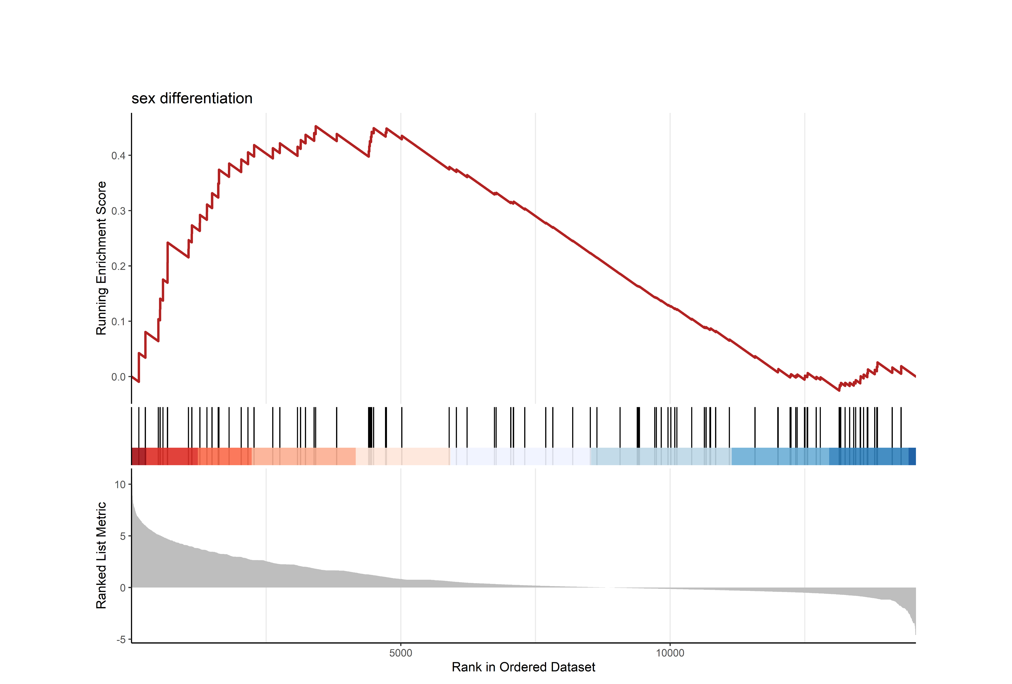
tiff("sex_differentiation.tiff",units = "in",width = 10,height = 7.2,res = 600)
gseaplot2(GO, "GO:0007548", color = "firebrick",
title = "sex differentiation",
rel_heights=c(1, .2, .6))
dev.off()
|