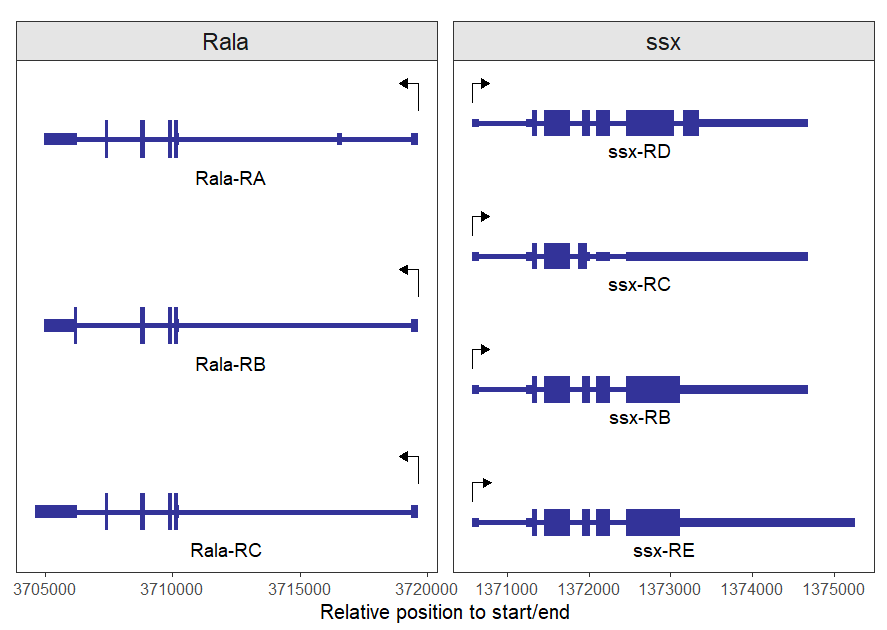
trancriptVis(gtfFile = gene.anno, gene =c('Rala',"ssx"),# Target gene to plot facetByGene =T, addNormalArrow =F, newStyleArrow =T, base_size =15,# Theme basesize, default(14). textLabel="transcript_name",# The text label aesthetic mappings, default('transcript_id') textLabelSize=5,# The text label size textLabelColor ="black",# The text label color intronSize=2,# Intron line size exonWidth=0.2,# exon width relTextDist=0.2,# marked_name relative to exon reverse.y=TRUE, xAxis.info=TRUE)# Whether retain X axis ticks and text
output:
.
.
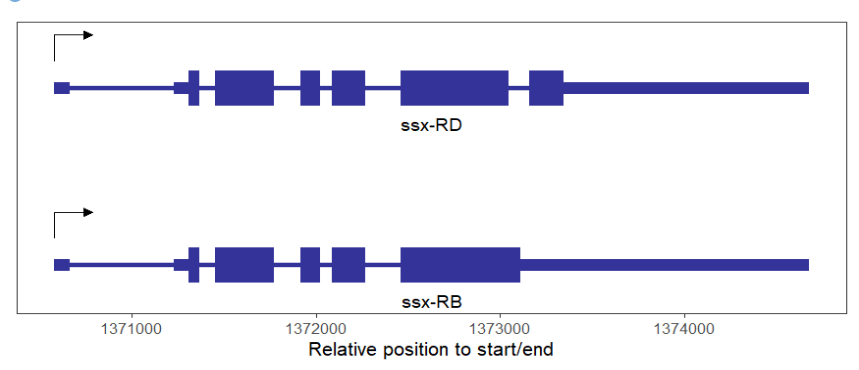
If we only want to display the specific transcripts of a gene that we are interested in, we can use this script as follows:
1
2
3
4
5
6
7
8
9
10
11
12
13
14
15
# select and plot only the target transcript by myTranscript ("transcript"_id) trancriptVis(gtfFile = gene.anno, gene =c('ssx'), myTranscript =c('FBtr0070215','FBtr0339773'), addNormalArrow =F, newStyleArrow =T, base_size =15, textLabel="transcript_name", textLabelSize=5, textLabelColor ="black", intronSize=2, exonWidth=0.2, relTextDist=0.2, reverse.y=TRUE, xAxis.info=TRUE)