1
2
3
4
5
6
7
8
9
10
11
12
13
14
15
16
17
18
19
20
21
22
23
24
25
26
27
28
29
30
31
|
library(ggplot2)
setwd("E:/220625_PC/R workplace/220320_SXL/202404_Fig/250210/")
tiff("50210_dT.tiff", units = "in", width = 7, height = 8, res = 900)
tiff("t_dT.tiff", units = "in", width = 7, height = 8, res = 900)
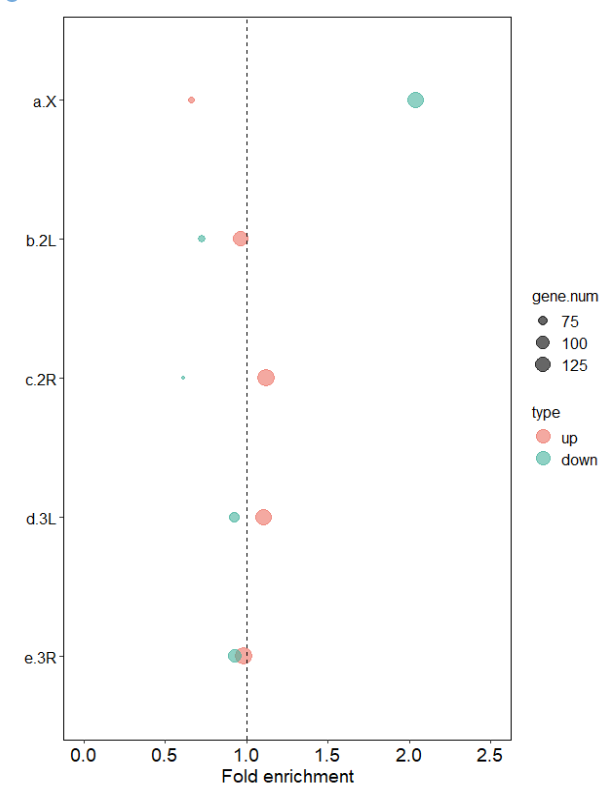
ggplot(plot_dT, aes(x = chr, y = enrich_fold, fill = type)) +
geom_point(aes(size = gene.num, color = type), alpha = 0.6) +
scale_fill_manual(values = c( "#EC7063","#45B39D")) +
scale_color_manual(values = c( "#EC7063","#45B39D")) +
coord_flip() +
theme_bw() +
theme(axis.text.x = element_text(angle = 0, hjust = 0.5, colour = "black", family = "blod", size = 14),
axis.text.y = element_text(family = "Times", size = 12, face = "plain", colour = "black"),
axis.title.y = element_text(family = "Times", size = 14, face = "plain"),
axis.title.x = element_text(family = "Times", size = 14, face = "plain"),
panel.border = element_blank(),
axis.line = element_line(colour = "black", size = 1),
panel.grid.major = element_blank(),
panel.grid.minor = element_blank()) +
theme(legend.text = element_text(size = 12)) +
theme(legend.title = element_text(size = 12)) +
guides(colour = guide_legend(override.aes = list(size=5)))+
scale_size_continuous(range = c(1,6))+
xlab(" ") + ylab("Fold enrichment") +
theme(panel.border = element_rect(fill = NA, color = "black", size = 0.5, linetype = "solid")) +
theme(axis.line.x = element_line(linetype = 1, color = "black", size = 0.5)) +
theme(axis.line.y = element_line(linetype = 1, color = "black", size = 0.5)) +
ylim(0, 2.5) +
geom_hline(aes(yintercept = 1), color = "black", linetype = "dashed")
dev.off()
|