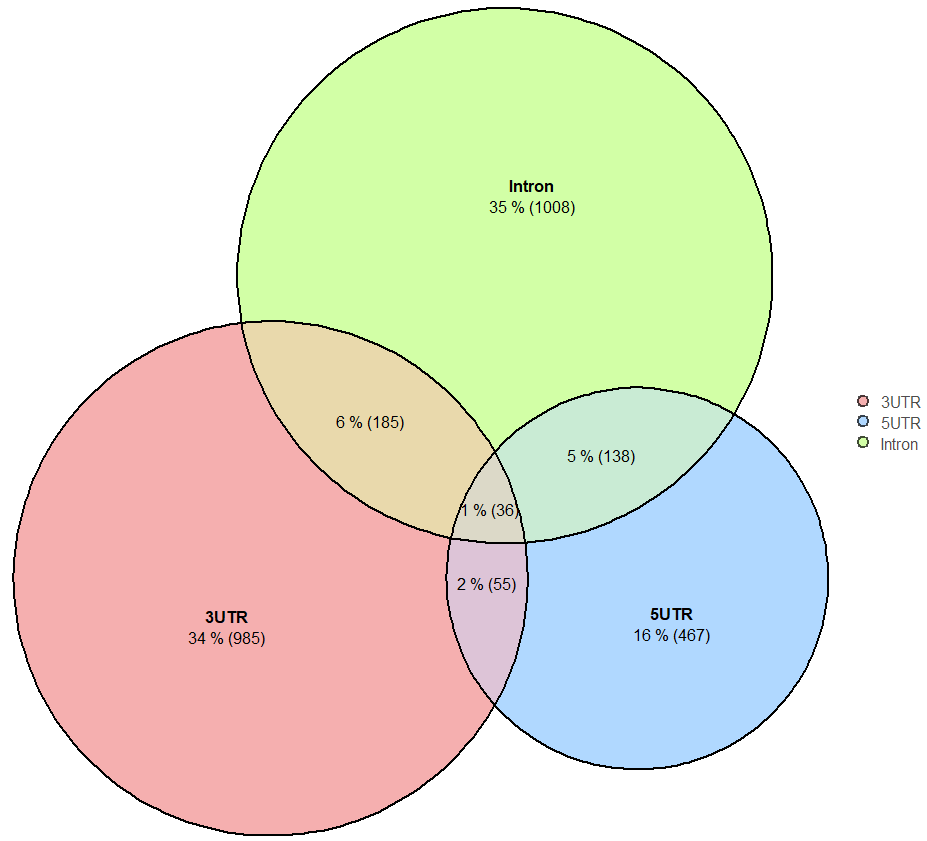
Sometimes, when creating a Venn diagram, we need the size of each area to be proportional to the values it represents. In this case, we require a proportional-area Venn diagram.
data_list <-list("3UTR"= peak_3UTR$geneID, "5UTR"= peak_5UTR$geneID, "Intron"= peak_Intron$geneID) data_list <- lapply(data_list,function(x) x[x !=""]) # Remove empty strings ("") from each vector in the list data_list <- lapply(data_list , unique) # Remove duplicate elements from each vector
.
plot
1 2 3 4 5 6 7 8 9 10 11 12 13 14 15 16 17
library(eulerr) plot(euler( data_list, shape ="circle"), # Shape of the pattern: ellipse or circle quantities =list(type =c("percent","counts"),cex=1), # Display type: percentage and numbers, with the ability to adjust the size of the numbers. labels=list(cex=1), # Size of the group labels edges =list(col ="black", lex =2), # Edge color and size of the shapes fills =list(fill =c("#f18c8d","#8ec7ff","#bfff7f"),alpha=0.7), # Fill color and transparency (opacity) legend =list(side ="right") # Position of the legend )