1
2
3
4
5
6
7
8
9
10
11
12
13
14
15
16
17
18
19
20
21
22
23
24
25
26
27
28
29
30
31
32
33
34
35
36
37
38
39
40
41
42
43
44
45
46
47
48
49
50
51
52
53
54
55
56
57
58
59
60
61
62
63
64
65
66
67
68
69
70
71
72
73
74
75
76
77
78
79
80
81
82
83
84
85
86
87
88
89
90
|
library(dplyr)
input_dat <-
input_dat %>%
mutate(
export_group = case_when(
input_dat$GeneID %in% FC_up$GeneID ~ "export_up",
input_dat$GeneID %in% FC_down$GeneID ~ "export_down",
TRUE ~ "export_no"),
transla_group = case_when(
input_dat$GeneID %in% TE_up$GeneID ~ "transla_up",
input_dat$GeneID %in% TE_down$GeneID ~ "transla_down",
TRUE ~ "transla_no"),
group = paste(export_group, transla_group, sep = " & ")
) %>%
select(-export_group, -transla_group)
table(input_dat$group)
input_dat$peak <- ifelse(input_dat$GeneID %in% peak_gene$GeneID,"Peak","non_Peak") %>% as.factor()
table(input_dat$peak)
library(pheatmap)
paletteLength <- length(rownames(input_dat))
myColor <- colorRampPalette(c("navy", "white", "red"))(paletteLength)
myBreaks <- c(seq(min(input_dat$log2FoldChange),
-0.1,
length.out=ceiling(paletteLength/2) + 1),
seq(0,
max(input_dat$log2FoldChange),
length.out=floor(paletteLength/2)
))
annotation_row <- input_dat[,c("gene_symbol","group","peak")]
row.names(annotation_row) <- input_dat$gene_symbol
annotation_row$group <- as.factor(annotation_row$group)
annotation_row$peak <- as.factor(annotation_row$peak)
annotation_row <- annotation_row[,-1]
groupcolor <- c('#641E16','#EC7063','#F5B7B1','#154360','#2471A3','#7FB3D5','#45B39D','#F2F3F4','#97C8AF')
names(groupcolor) <- c('export_down & transla_up',
'export_down & transla_down',
'export_down & transla_no',
'export_up & transla_up',
'export_up & transla_no',
'export_up & transla_down',
'export_no & transla_up',
'export_no & transla_no',
'export_no & transla_down')
peakcolor <- c('#4D5656','#CACFD2')
names(peakcolor) <- c("Peak","non_Peak")
ann_colors <- list(group=groupcolor,
peak= peakcolor)
rownames(input_dat) <- input_dat$gene_symbol
plot_dat <- input_dat[,c("log2FC_Sxl.WT","log2FoldChange")]
colnames(plot_dat) <- c("export","trabsla")
row_dist = dist(plot_dat)
hclust_1 <- hclust(row_dist)
dend = reorder(as.dendrogram(hclust_1), wts=plot_dat$log2FoldChange*(-1))
row_cluster <- as.hclust(dend)
setwd("E:/220625_PC/R workplace/220320_SXL/202404_Fig/250221/")
pdf("heatmap_export_transla.pdf",width = 6,height = 8)
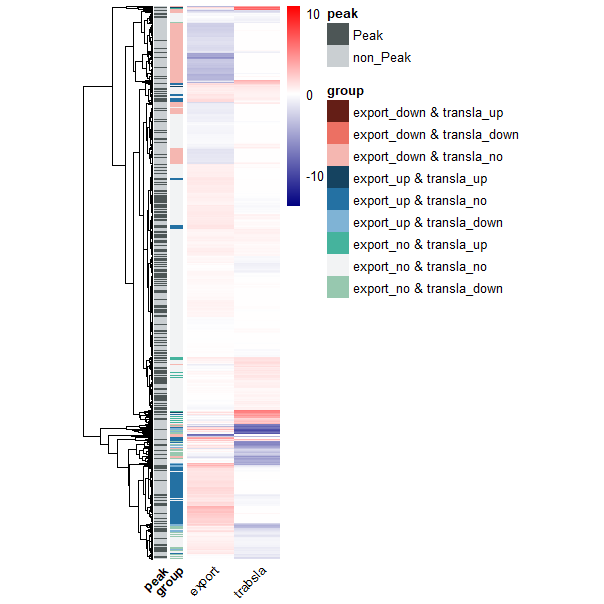
pheatmap(plot_dat,
cluster_row = T,
cluster_col=F,
cutree_rows=1,
cutree_cols =2,
treeheight_row=50,
legend_breaks=c(-10,0,10),
breaks = myBreaks,
show_rownames = F,
angle_col = 45,
cellwidth = 35,
border_color = NULL,
color = myColor,
annotation_row = annotation_row,
annotation_colors = ann_colors,
cluster_rows = row_cluster)
dev.off()
|
